 |
| Source: pixabay |
Imagine a conventional aircraft, like the ones which are flying across the world carrying passengers, for example. There is a very subtle and intriguing fact (at least for flight mechanics geeks) when the aircraft is commanded “to climb up”: the very first response of the aircraft body, for a short time period, is in the other way round, i.e., it dives a very little bit before climbing up. This fact is well explained by the aeronautical engineering experts and I’ll try to build up this explanation throughout the following lines. I’m assuming the reader has only some Mechanics background in the beginning, but the last section will require some Control Theory background, once that we will try to illustrate this puzzling concept called Non-Minimum-Phase (NMP) zero.
What actually happens
Let us start picking up some facts very well explained by the giants (Stevens And Lewis, John Anderson, Robert Nelson, etc). A conventional aircraft, flying straight with no changes in its altitude, has wings with this magical shape such that, roughly speaking, the greater the angle between a centerline through the wing section and the wind direction (called angle-of-attack), the greater the magnitude of the supernatural force upwards, called lift (Figure 1). The basics of the aircraft longitudinal commands (upwards and downwards) will be provided by the balance of the forces generated by the main wing and the horizontal stabilizer (little wing at the rear of the fuselage). More specifically, the longitudinal dynamics of the aircraft will be performed by the elevators, the small moving surfaces at the rear of the horizontal stabilizer. Moving up or down (both left and right simultaneously), the elevators are able to vary the vertical forces on the horizontal stabilizer making the aircraft climb or dive in a short term (assuming constant the other aircraft commands inputs) (Figure 2).
 |
| Figure 1. Angle-of-attack and lift force, assuming straight level flight. |
 |
| Figure 2. Elevator commands and longitudinal dynamics. Left sketch: elevators up, force in horizontal stabilizer downwards, counter-clockwise momentum, nose-up movement; right sketch: elevators down, force in horizontal stabilizer upwards, clockwise momentum, nose-down movement. |
Considering our aircraft, flying straight and steadily with constant speed and altitude, if the elevators are moved upwards, we have the following sequence of events:
This sequence of events is assuming a time frame of few seconds after the elevators command, because in a long term, the aircraft will decelerate and require other input commands to restore the equilibrium condition or to settle in a new one.
But notice that the very first dynamic response of the aircraft (described by item 2) is in the opposite sense of the intended response, which is increasing the overall lift force of the aircraft. And so far we have a hypothesis. We need a model to confirm our suspicion and to dig into the details a bit deeper.
- The final elevators position causes a decrease in the lift force on the horizontal stabilizer. The force vector can even possibly turn to downward sense;
- The overall lift force acting in the aircraft decreases and the weight now is greater than the lift force, making the whole body accelerate downwards;
- The variation of the force in the tail generates an angular momentum, resulting in a pitching up movement (aircraft nose up);
- The nose up movement increases the angle-of-attack of the wing and therefore the lift on the wing;
- The angular momentum variation due to the new angle-of-attack of the wing counteracts the momentum variation due to the vertical force on the stabilizer, eventually breaking the pitching up movement;
- The increase in the lift on the wing is greater than the decrease in the lift on the horizontal stabilizer such that the overall lift force results greater than the weight, making the whole body finally accelerate upwards.
This sequence of events is assuming a time frame of few seconds after the elevators command, because in a long term, the aircraft will decelerate and require other input commands to restore the equilibrium condition or to settle in a new one.
But notice that the very first dynamic response of the aircraft (described by item 2) is in the opposite sense of the intended response, which is increasing the overall lift force of the aircraft. And so far we have a hypothesis. We need a model to confirm our suspicion and to dig into the details a bit deeper.
We need a model
Making science is not an easy job, neither is it cheap. So let’s trust the giants Stevens and Lewis and borrow their F-16 model. Just considering the hours of wind tunnel tests, the hours of engineering work compiling the aerodynamic data and the hours of real flight to validate the data make the costs go beyond the hundreds of thousands of US dollars (the hourly operating costs of the F-16 is around US$ 8,000). Luckily to me it only costs few days translating the Fortran code to Scilab and typing the aerodynamic data to the computer. I made the code available at GitHub, named mcflight.
Our model is a dynamic representation of an aircraft able to move in so-called 6 degrees of freedom (shortly 6 DOF): roughly speaking, 3 translational and 3 rotational movement possibilities (Figure 3). Although, for the simulation we are interested in, we only need 3 degrees of freedom, once that we are dealing only with longitudinal axis (i.e., translational movements upward/downward and backward/forward, and rotational movement of aircraft nose up/down).
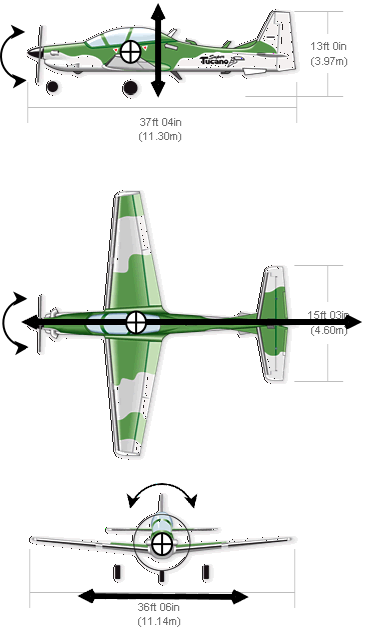 |
| Figure 3. Six degrees of freedom. The straight lines mean translational movements of back and forth following the arrows directions; the arches mean rotational movements clockwise and counter-clockwise around the center of gravity of the aircraft (assumed to be in the circle with the cross in the pictures). (Embraer super-tucano three views were found here). |
By dynamic representation we mean a set of differential equations whose solution will provide us with the description of the aircraft movement throughout the time (for a very detailed explanation about the equations please check chapter 2 of Stevens and Lewis). In order to validate our hypothesis, we will need to “make” the aircraft fly steadily (wings level, straight flight) and then apply a small deflection on elevators to make the nose up. If we are right, we will observe a small decrease in lift force before building up.
To observe the lift force, in flight mechanics we use a physical quantity called load factor which is simply the ratio between the Lift force and the Weight (Figure 4). Although it is dimensionless, we express the load factor in g (referring to acceleration of gravity) and it can be positive, when Lift is in upward sense, or negative, otherwise. A very good g-meter is our stomach and you probably have experienced some g’s (positive) when riding a roller coaster. When an aircraft is flying straight and you are indulging yourself with a hot beverage served by the flight attendant, the load factor is 1 g (i.e. weight equals to lift) at that moment. During a normal airline flight you will experience slight variations around 1g, but the load factor will always be greater than 0. The negative g’s are experienced in aerobatic flights, for example, and notice that it is not only a simply free fall (which would be 0 g) but an acceleration downwards.
To observe the lift force, in flight mechanics we use a physical quantity called load factor which is simply the ratio between the Lift force and the Weight (Figure 4). Although it is dimensionless, we express the load factor in g (referring to acceleration of gravity) and it can be positive, when Lift is in upward sense, or negative, otherwise. A very good g-meter is our stomach and you probably have experienced some g’s (positive) when riding a roller coaster. When an aircraft is flying straight and you are indulging yourself with a hot beverage served by the flight attendant, the load factor is 1 g (i.e. weight equals to lift) at that moment. During a normal airline flight you will experience slight variations around 1g, but the load factor will always be greater than 0. The negative g’s are experienced in aerobatic flights, for example, and notice that it is not only a simply free fall (which would be 0 g) but an acceleration downwards.
 |
| Figure 4. Load factor. Ratio between Lift Force and Weight. |
Finally simulating
We are going to run a set of scilab scripts, analyze the time history of some variables (such as load factor) and use a lot of imagination to see an F-16 flying around.
The first step is to put our aircraft in a steady flight condition, which in our case means finding the elevator deflection and throttle setting (i.e., thrust provided by the engines) to allow a flight at constant speed, constant altitude, constant angle-of-attack. In other words, this is an equilibrium condition. The translation of this problem to our physical model is finding the solution of the differential equation using the proper set of constraints. In Aeronautics this is called trimming the aircraft. So let’s trim the aircraft in straight flight with wings level at sea level (altitude 0 ft) and with a speed of 200 ft/s. Asking scilab to solve it for us, we find the condition shown in Figure 5.
Altitude (h): 0 ft (sea level)
Speed (V): 200 ft/s
Throttle setting (engine): 0.287 (from 0 to 1)
Elevator deflection: 0.72° (-25.00° to 25.00°)
Angle-of-attack (alpha): 19.70º
Figure 5. Trim condition.
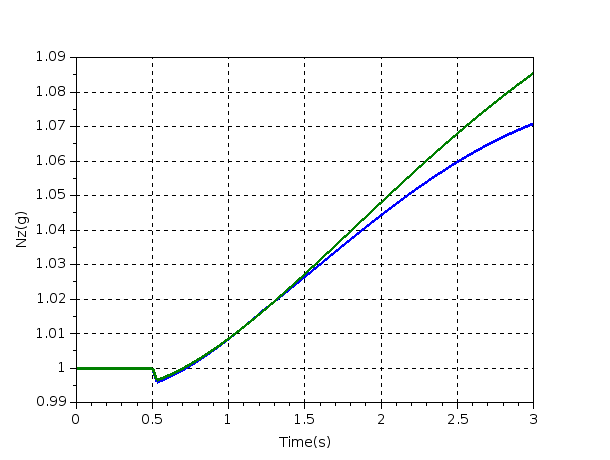
Let’s then apply the elevator deflection. In a time history simulation, we can say that it is a good practice to leave the aircraft fly steadily for a fraction of second (at least) just to check if there is an equilibrium point, before applying the input change. The following curves will show a time frame of 3 seconds of flight simulation with an elevator deflection of -1°, applied from 0.50s to 0.53s.
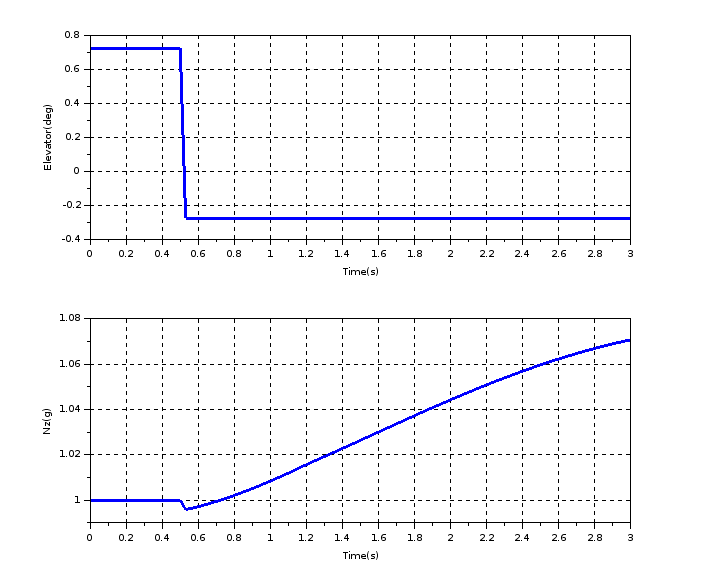 |
| Figure 6. Load factor (Nz) and elevator deflection curves. |
As we expected, the first dynamic response of the elevator deflection is a decrease in Nz. Then (after 0.53s) there is a monotonic increase in Nz until the end of the simulation. The Figure 7 shows the correspondence of the explained items in the previous section and the moments in the simulation zoomed in the first second of simulation.
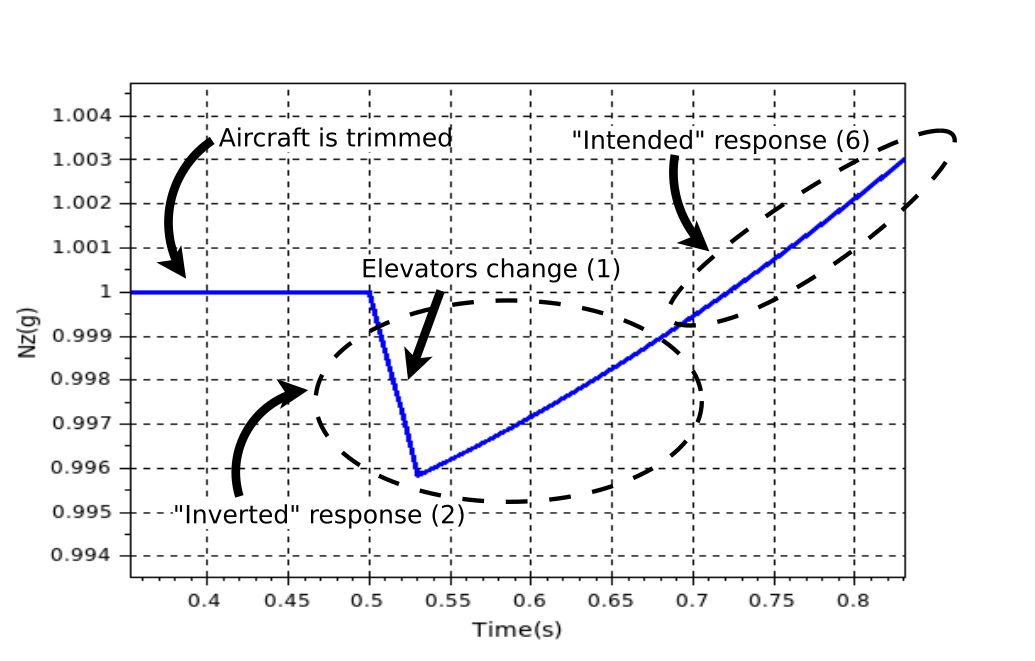 |
| Figure 7. Nz response right after elevator deflection. The numbers in parentheses indicate the corresponding item of explanation in the first section. |
Notice that the amount of variation of Nz is around 0.004g, decreasing from 1.000g to 0.996g and increasing back in less 0.2s. This would be probable unperceivable by someone in the aircraft. A fighter like the F-16 is designed to be agile, to have a very fast dynamic response. If we had a model of a bigger guy (a cargo aircraft, for instance), the variation of Nz certainly would be slower and with a bigger magnitude (hopefully we will have another aircraft model available at mcflight soon). Figure 8 shows an illustrative animation of the F-16 flight.
We could play with some parameters of our aircraft model to artificially make it have a behaviour similar to the bigger aircrafts. For example, we could change its ability to spin around the axis of the wings, i.e., the ability to nose up or down. Physically this means changing the moment of inertia around this axis. Try this out with mcflight code, varying the value of AYY.
 |
| Figure 8. Simulation F-16 model. Notice that the animation illustrates the drop in altitude, which is not coincident with the drop in Nz in the events timeline. Also the drop in altitude was (very) exaggerated for matters of illustration. |
We could play with some parameters of our aircraft model to artificially make it have a behaviour similar to the bigger aircrafts. For example, we could change its ability to spin around the axis of the wings, i.e., the ability to nose up or down. Physically this means changing the moment of inertia around this axis. Try this out with mcflight code, varying the value of AYY.
From a Control Theory Point of View
From now on, it will be necessary some Control Theory background to fully understand it. A brave reader can keep going without this.
Considering the trim condition described in the previous section, we performed a linearization in order to find the state-space representation (Figure 9). In our Scilab scripts, this means using the command lin to find the matrices A, B, C and D and syslin to build a Scilab state-space representation. Mathematically we are reducing our flight dynamics to a first-order linear system representation of the equations. This will allow us to use the very well established theory of linear systems but the drawback is that this simplification is only compatible with the original (non-linear) model in the surroundings of the trim condition. So, before doing anything, we have to check the matching between our linear and non-linear models.
 |
| Figure 9. State-space representation, where x is the state variables vector, u is the control variables vector and y is the output variables vector. |
Our linear representation is assuming the following variables:
- Control variables (u): throttle setting (engines) and elevator deflection;
- State variables (x): air-speed (assume that this equals to aircraft speed), angle-of-attack (alpha), attitude angle (theta, angle related to the horizon, initially equals to alpha), altitude, engine power setting.
- Output variables (y): load factor (Nz).
 |
| Figure 10. Comparison between linear and non-linear simulations. |
We are now ready to take a look on the poles and zeros of the transfer function of the system elevator-to-nz (Figure 10). Notice that we have a zero in the right-half-plane, also known as non-minimum-phase (NMP) zero (actually, we have three positive zeros, but the ones nearby the origin are due to the fact we inserted altitude and engine power as states, you can check this, eliminating them as state variables). And this guy is the guilty of the phenomenon we are describing here as stated by Stevens and Lewis (again): “these types of zeros occur when there are two or more different paths to the system output, or two or more different physical mechanisms, producing competing output components”. Yes, we have horizontal stabilizer and wings producing lift and affecting the load factor.
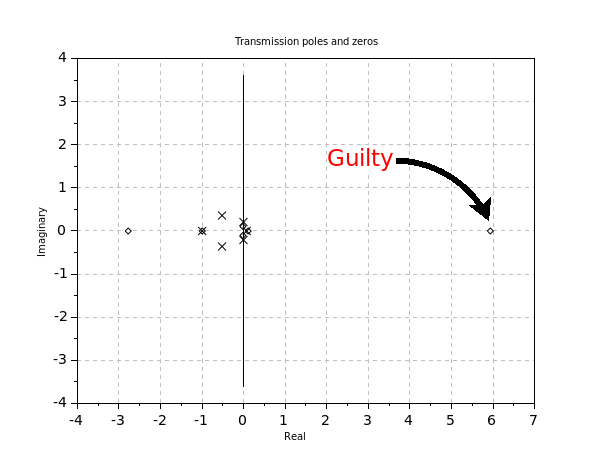 |
| Figure 11. Poles and zeros of linear system elevator-to-nz. |
Well, next time you are in a straight level flight of an airliner and all of a sudden you feel a quick and slight “floating” out of your seat (Nz less than 1g) before “sticking” to it (Nz greater than 1g) when the aircraft starts climbing, you can tell the passenger at your side that such sequence of events was caused by an NMP zero in the plant. Actually this is very unlikely, unless you have a g-meter with you. Anyway, at least the explanation you know ;-)
Nice post.Keep updating Artificial Intelligence Online Training
ReplyDeletethank you for the explanation!
ReplyDeleteen son çıkan perde modelleri
ReplyDeleteen son çıkan perde modelleri
minecraft premium
nft nasıl alınır
yurtdışı kargo
lisans satın al
uc satın al
özel ambulans